
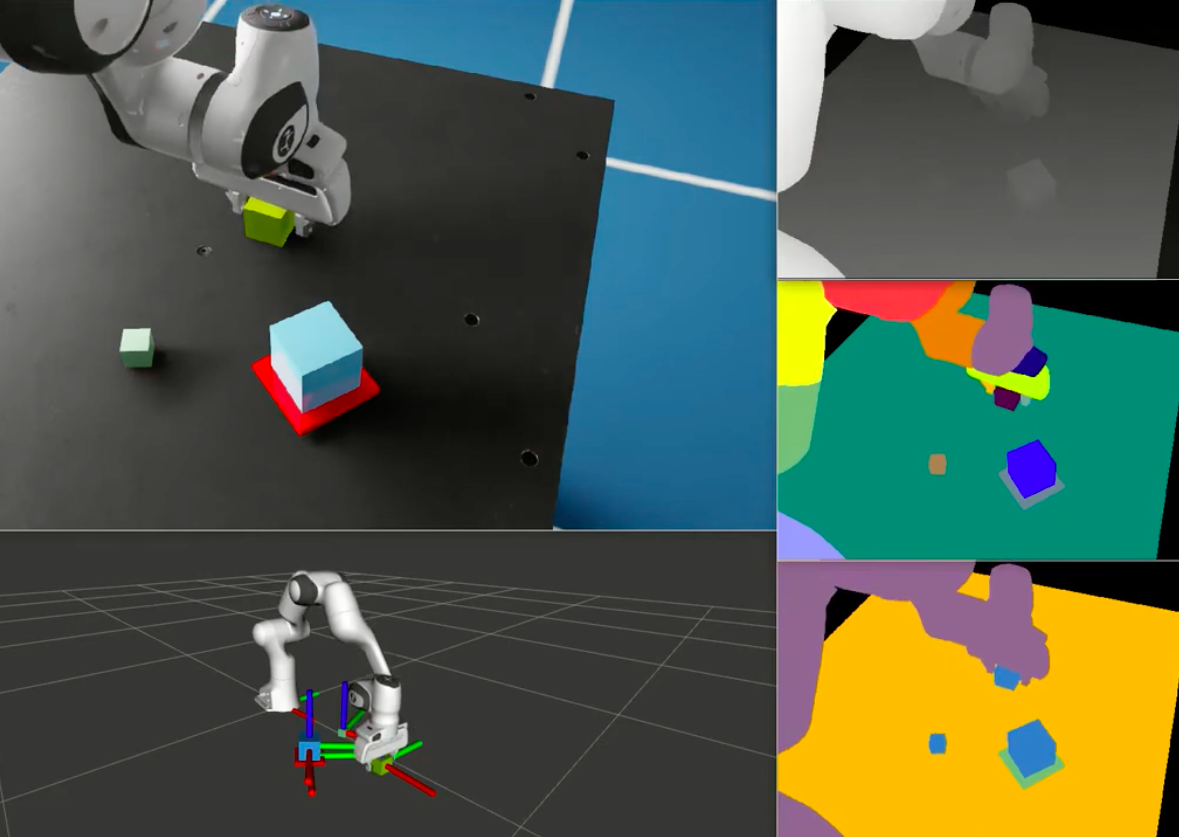
Our lab had developed a point cloud segmentation C++ library that we utilized in experiments to segment out objects in the point clouds we would get from Kinect sensors. Typically we would want to obtain just the point cloud of an object to be manipulated by the robot, and ignore everything else like the point cloud of the table the object is resting on, the point cloud of the robot, and spurious points in the scene. Once the object’s point cloud was isolated, we could run a procedure like RANSAC using the object’s mesh to determine the pose of the object in the scene, which is incredibly useful information for the robot seeking to manipulate the object.
Problem
The segmentation algorithms required the user to specify a region over which segmentation should be applied. It was important to be accurate in specifying this region or you may segment out something that is not the object and you will subsequently get a wrong pose estimate for the object of interest. At the time I was trying to use the library, the way to do this was a tedious guess-and-check approach of setting the boundary manually by typing in your guess at the extreme points of the cuboid region of interest, running the segmentation, and looking at the resulting point cloud to see if it got your object. I did this exactly once and realized this was going to be a real time sink – if the camera or table moves, you have to redo the trial and error procedure, and you’re having to guess these values in the camera’s coordinate frame which is not at all intuitive to do.
My thought was I should be able to visualize the active region being used in the segmentation, I shouldn’t have to try to intuit what it currently is doing mental transformations in the camera’s frame and trying to map that to reality. The region is a cuboid, it’s easy to visualize, let’s visualize it! I also felt there was no reason I should even be typing in numbers to specify the region, I should be able to interact with the region’s visualization and adjust it with a user interface.
Solution
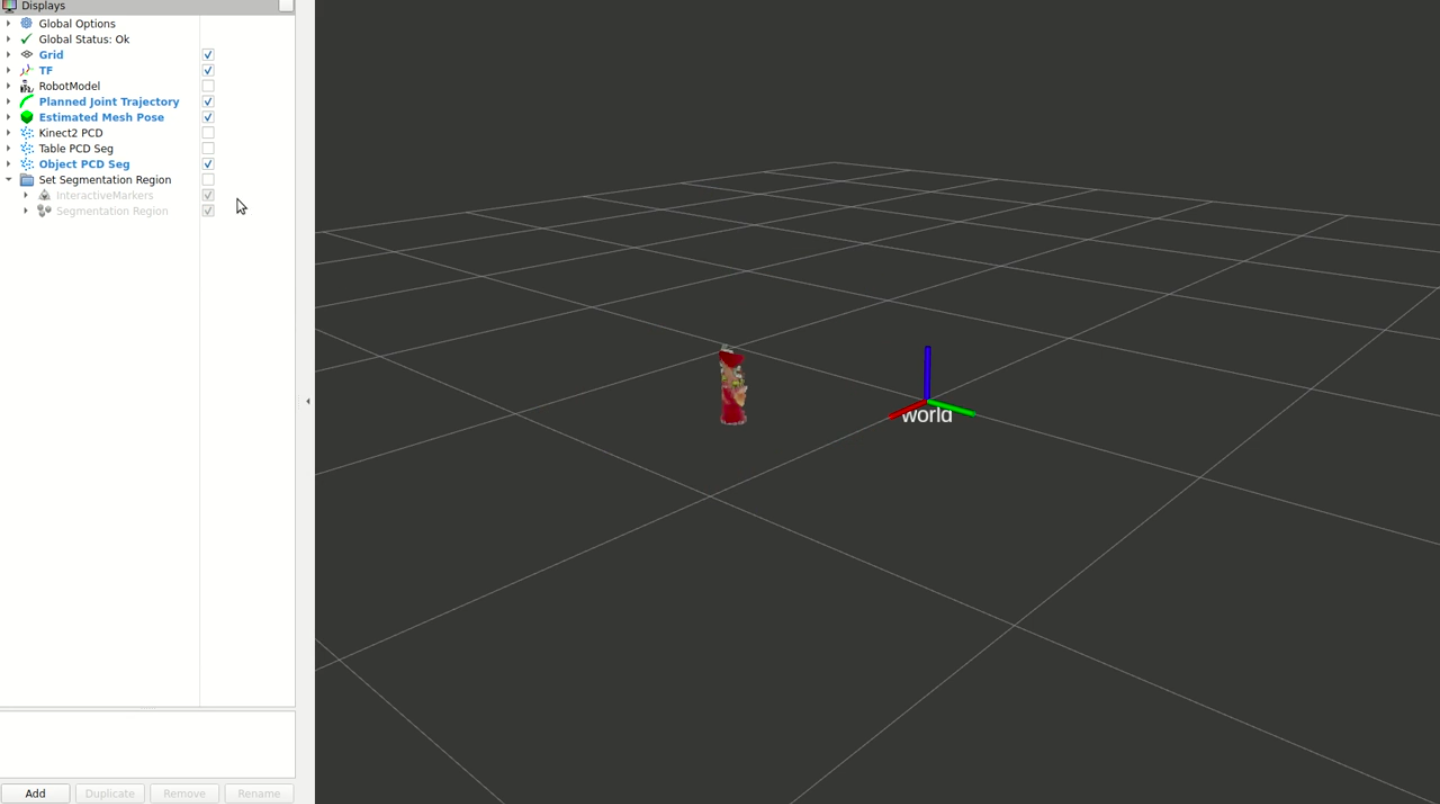
My solution was to develop an interactive visualizer in rviz where I could use a Marker to visualize the region, and InteractiveMarkers to enable the user to adjust the current selected region.
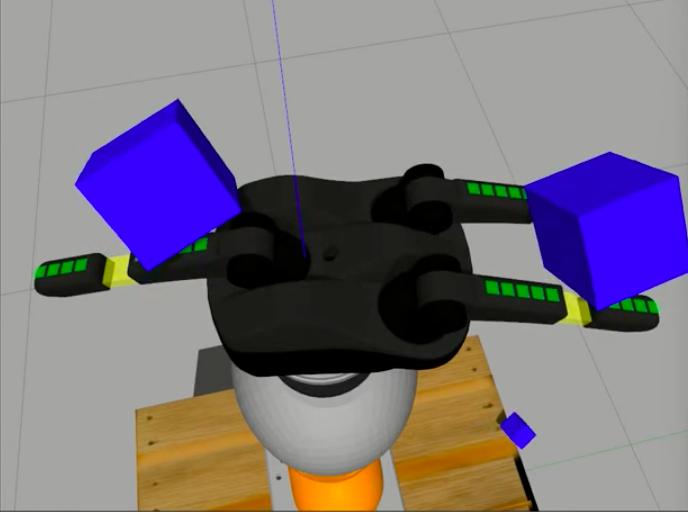
The user is presented a semi-transparent cuboid overlayed on the current point cloud published from the camera, where the cuboid is showing the current region the segmentation algorithm will operate on. The cuboid has 6 interactive arrows attached to it, 2 for each of the XYZ coordinate direction, colored conventionally to indicate the dimension it’s associated with, X (red), Y (green), and Z (blue).
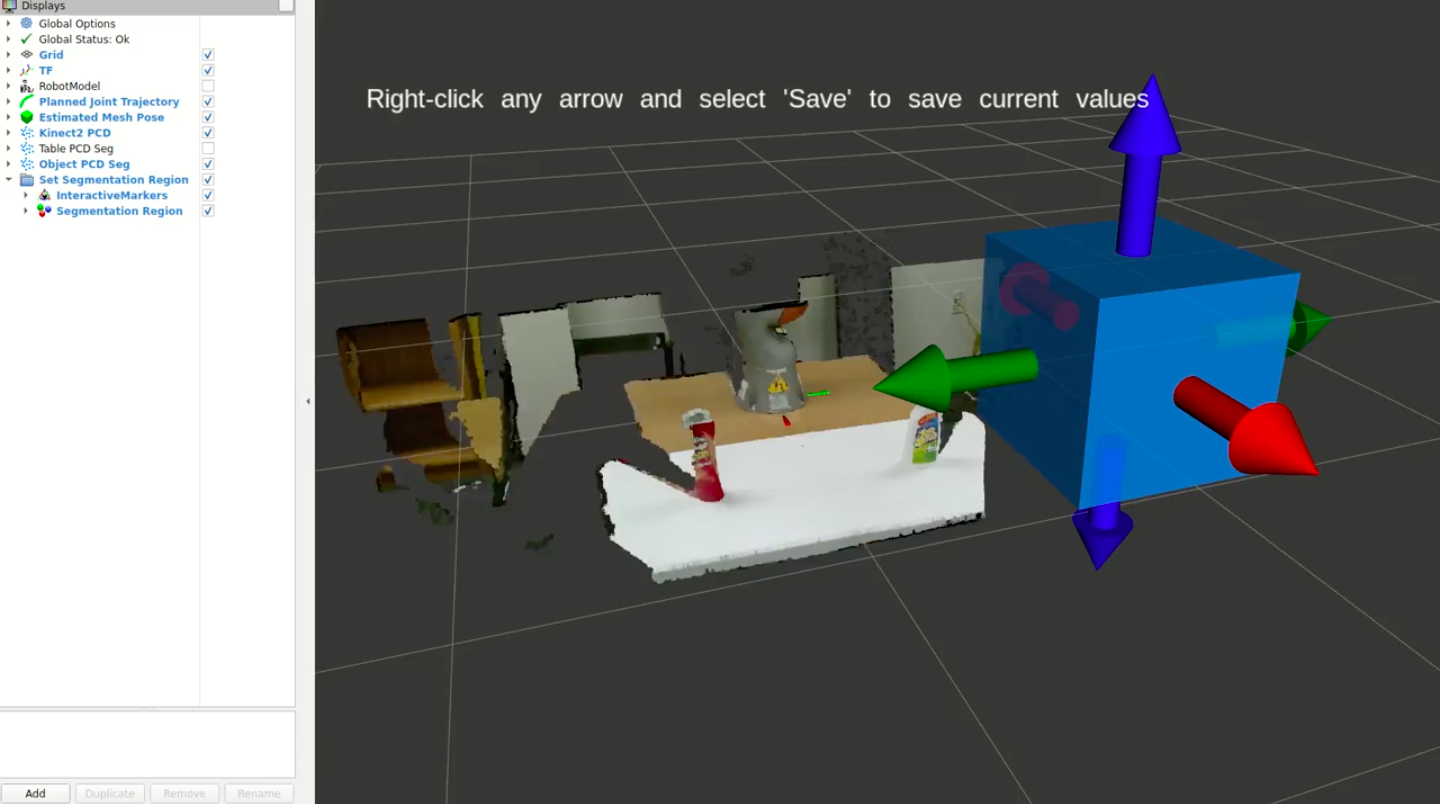
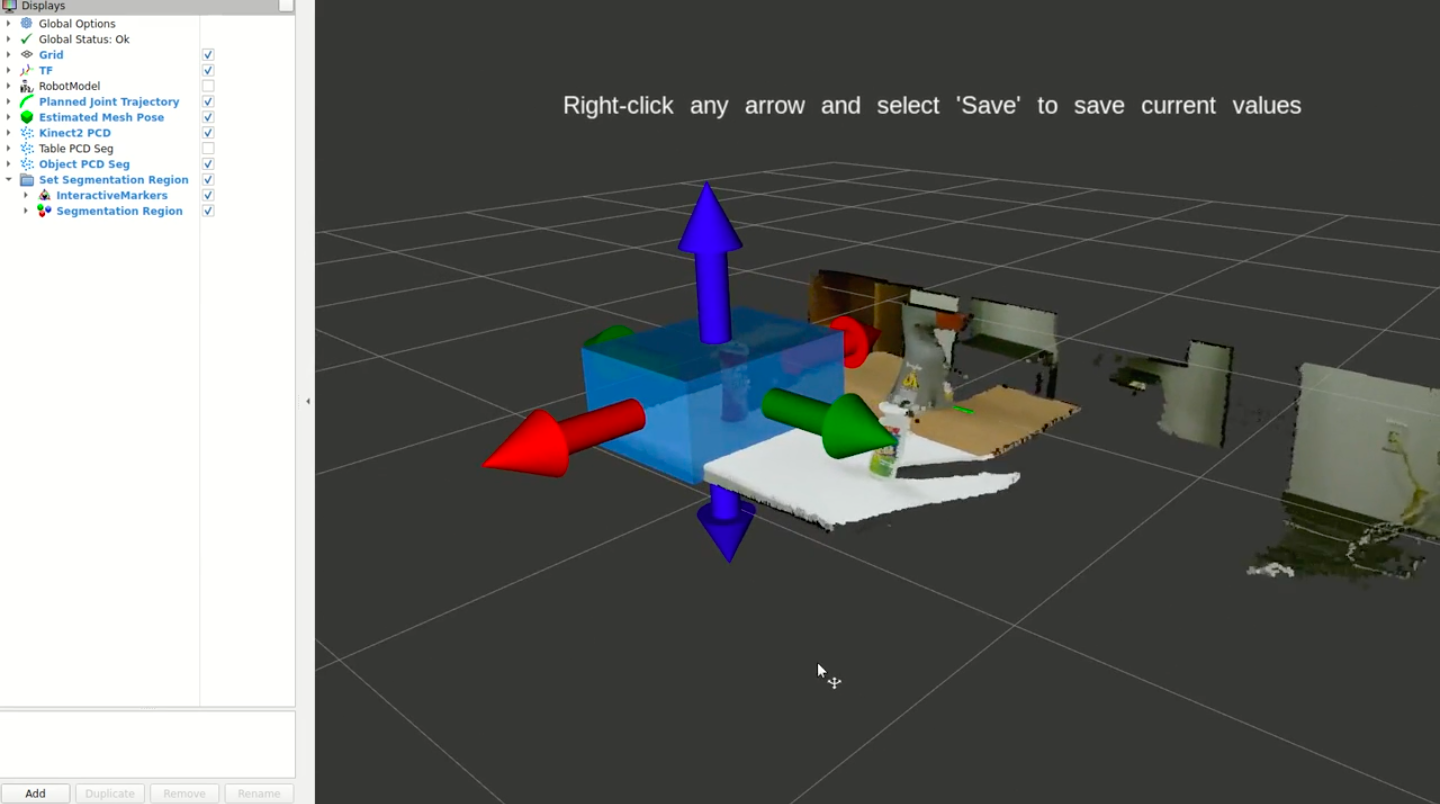
Clicking on an arrow and holding the mouse button down enables the user to drag their mouse along that dimension to change the extent of the cuboid in that dimension along the direction they drag their mouse.
Once the mouse button is released, the cuboid extent is fixed in that dimension, and the user can adjust each of the 6 sides of the region until they are happy with it.
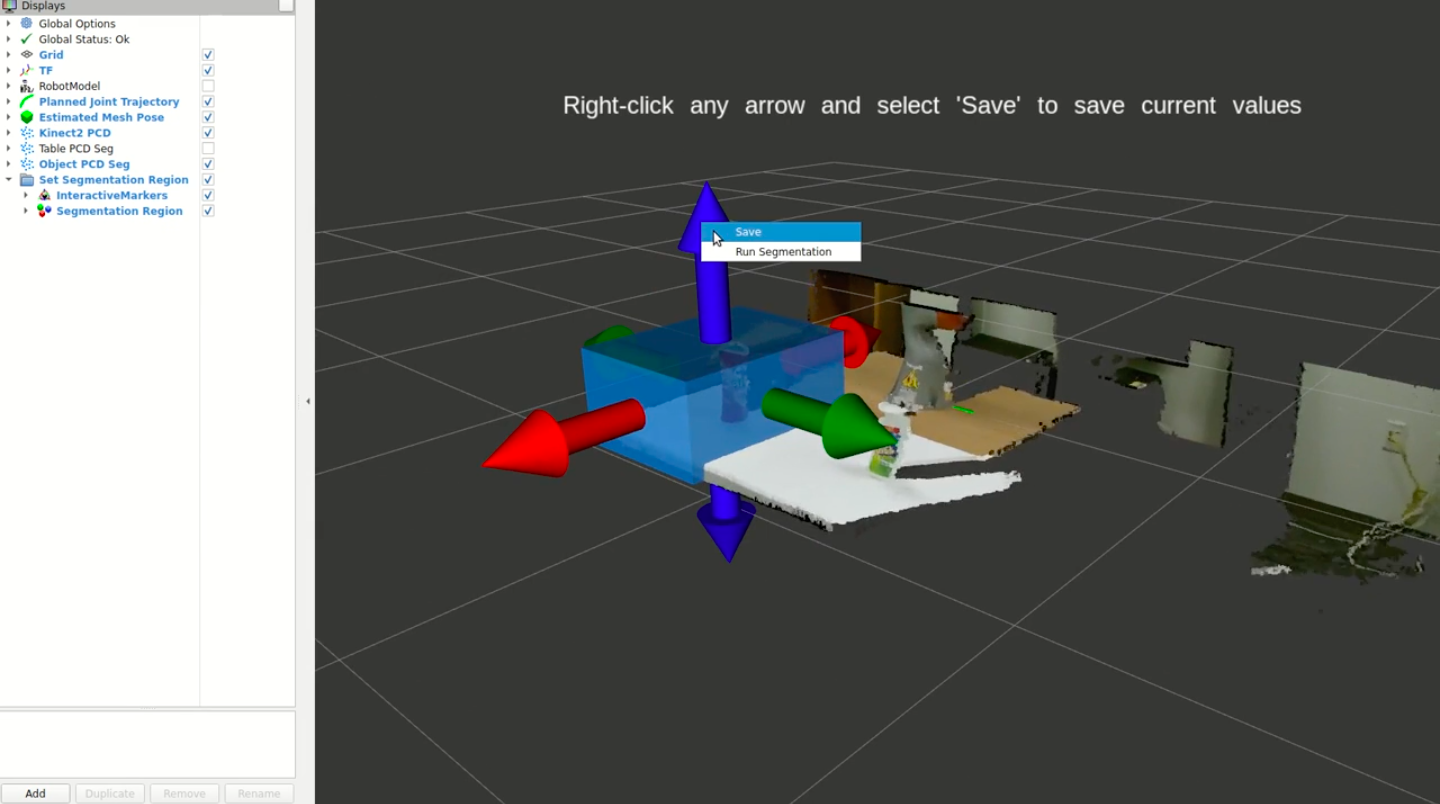
Once the region looks good, the user can right-click any of the arrows and a simple menu pops up where they can select to save the region. This initiates a ROS service call to set the parameters of the region in the backend for the algorithms to utilize.
To ensure the segmentation will actually select the object of interest at runtime, the user can again right-click an arrow and select “Run Segmentation” and it will initiate a ROS service call to run the segmentation algorithm using the current region enclosed by the visualized cuboid.
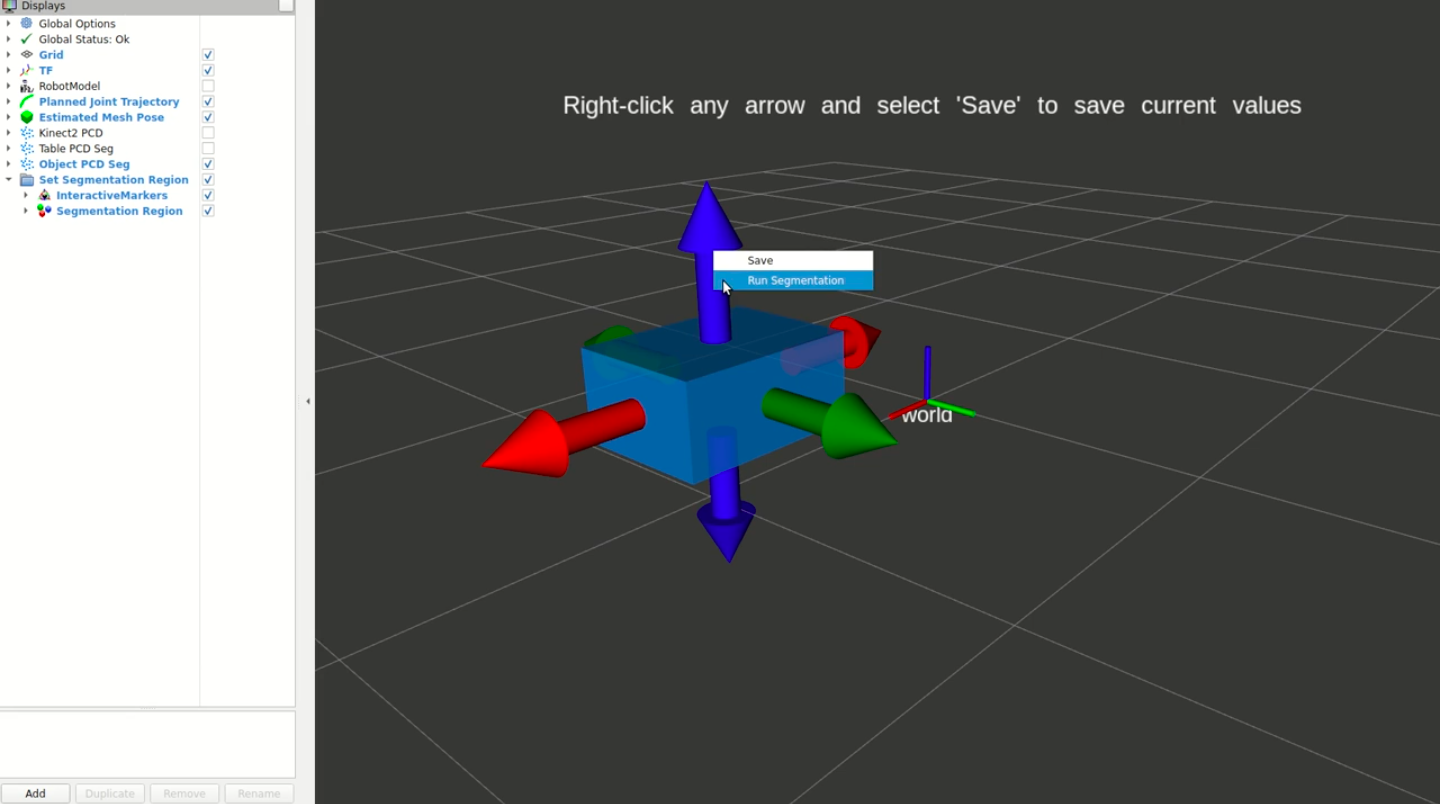
The user can then inspect the resulting segmented point cloud to ensure only the object (or other things of interest) are visualized. If it includes other points that aren’t desired, the user can iterate on their selection until it includes only the desired points.
Typically it would nail it the first try, and would only take at most 2-3 iterations to get exactly what you wanted. This is in comparison to 10-15 tries doing it manually without the visualizer. This saved me A LOT of time, because I was moving the camera around a lot in my experiments to try different angles and I was having to re-specify the region of interest frequently. With the visualizer, it was no burden to me and even enjoyable to use.
Technical Details
While on some level this was a simple tool to implement (hooking up ROS service calls, using common rviz visualizations, etc.), there was at least one challenging aspect of this which I found interesting. Even though the interactive markers provide an option to use XYZ controls simultaneously on a single marker, AND render a shape like a cuboid in the interior, I couldn’t figure out a way to dynamically change the size of that cuboid while keeping the interactive marker controls at the boundary of the cuboid, which is ultimately what I needed.
My solution was to use 6 different interactive markers, 2 for each XYZ dimension, one for the positive direction and one for the negative direction. Another marker (not an interactive one) rendered the cuboid region, and its extents were dynamically changed based on the current position of all of the interactive markers. To get the interactions to make sense such that the interactive markers would stay attached to the cuboid boundary, I had to incorporate some simple math to set ALL of the marker poses anytime any one of the interactive markers were moved. Because the cuboid marker is defined as extents about a center origin, you have to change both the cuboid’s origin and extents, as well as the interactive marker poses, so that everything stays consistent.
For example, if you move the +X marker 1 meter, the cuboid origin needs to shift 0.5 meters, and the extent in the X dimension needs to increase by 0.5 meters. The pose of the YZ interactive markers in this case all need to be adjusted in the +X direction as well by 0.5 meters so they track with the origin of cuboid. These updates are happening at a 100hZ so from the user’s perspective, they just drag around the arrows and see the extent of the cuboid change in that dimension/direction. In the backend the pose and extent computations are driving the updates to give the right user experience.
Limitations
This approach worked beautifully for our lab setup, but it wasn’t without limitations. The initial pose of the cuboid is set to something sensible in the world coordinate frame, but there isn’t currently an option to modify the initial pose. This was something on my mind that I never had the chance to go back and implement. That means it will always be axis-aligned to the world frame, so if your table were yawed from that frame then you won’t be able to enclose the region of interest as nicely. I think the solution is to add another interactive marker to control orientation of the cuboid, or make the cuboid an interactive marker that you could manipulate.
Another obvious limitation is it’s only one cuboid! If you had disjoint regions you wanted to select, or if you wanted to explicitly exclude a region within the selected region, it’s not possible with the single cuboid region I implemented. I think it would be relatively straight-forward to allow for multiple instances to run at the same time if you set the ROS namespaces appropriately, and that would be an easy way to get disjoint regions. But we had a relatively simple use case of single object on single table so I didn’t explore this route at the time.